Written by: The MacroButler
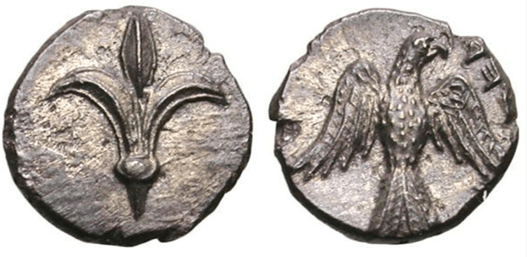
In antique history, the Judaean silver trade played a pivotal role in the ancient economy, especially during the late Second Temple period, when the region fell successively under Persian, Hellenistic, and later Roman rule. Silver served as the primary medium of exchange, with Tyrian shekels emerging as the preferred coinage for temple transactions, including the annual temple tax paid by Jewish pilgrims. Judaea’s access to silver relied on trade networks linking it to Mediterranean markets, facilitated largely by Phoenician merchants and Nabataean traders, who sustained commerce along vital trade routes. Furthermore, Rome’s dominance over the province amplified silver’s economic importance, as heavy taxation and tribute demands frequently depleted local reserves. Despite these pressures, silver remained essential to both commerce and religious obligations, underscoring its enduring significance in Judaean society until the region’s economic decline following the Jewish-Roman wars.
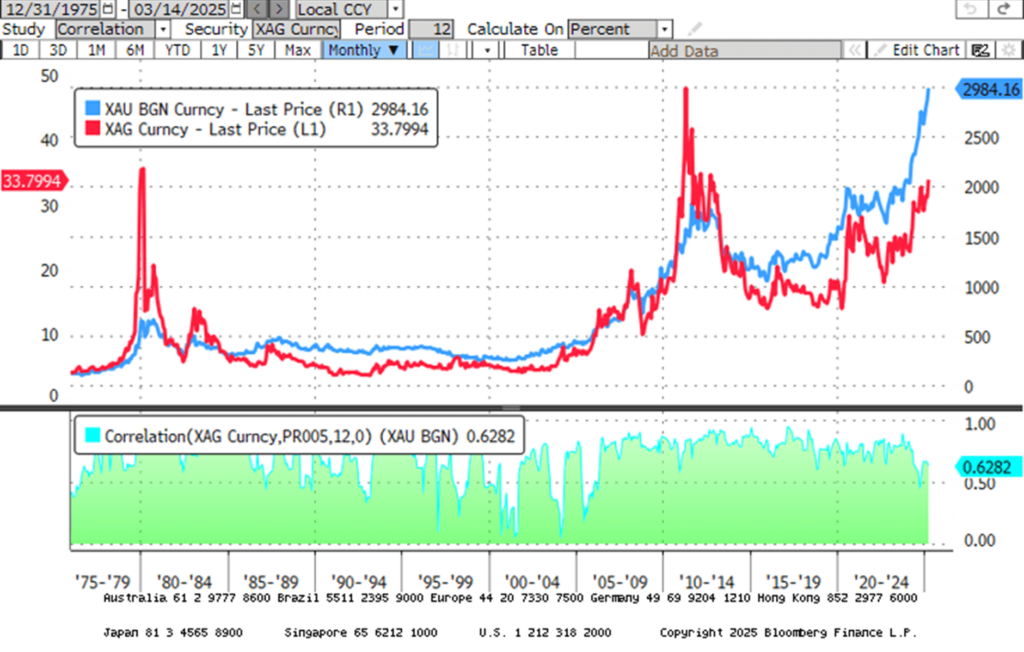
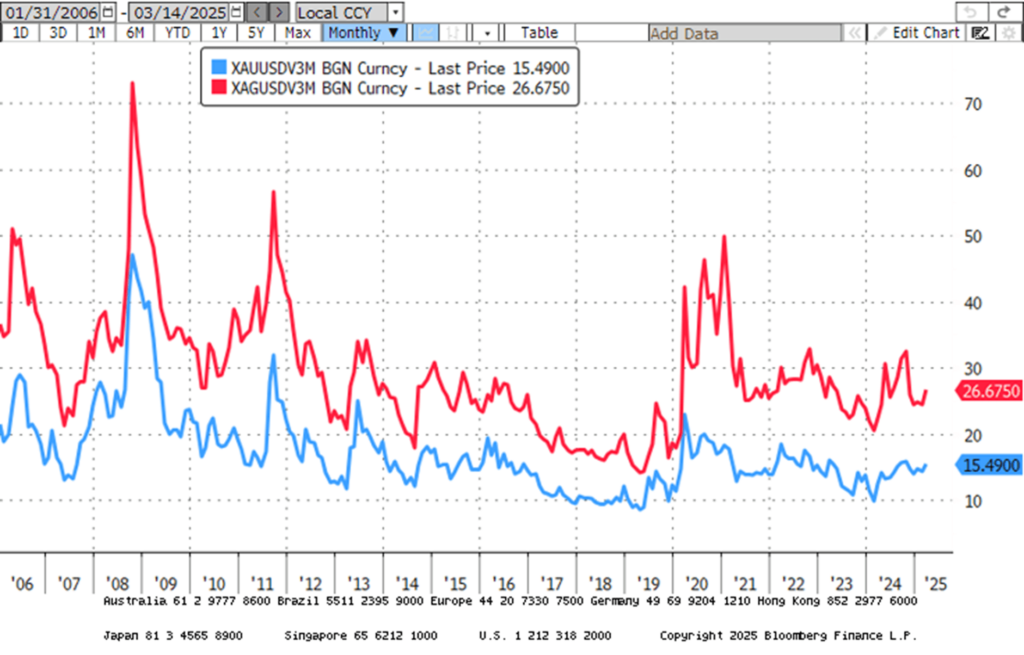
Since the start of this decade, marked by the growing weaponization of financial assets as governments worldwide have curtailed investors’ financial independence, particularly those resisting propagandistic and imperialistic narratives, gold and silver stand as the only antifragile assets free of counterparty risk. Looking further back, over the past 50 years, their correlation has consistently exceeded 0.5, indicating that choosing between them has rarely been a critical decision for asset allocators. Both metals effectively shield wealth from reckless spending by increasingly plutocratic governments, regardless of leadership.
Price in USD of physical gold (blue line); physical silver (red line) and correlations.
Since silver has far more industrial applications than gold, the ‘silver bird’ has historically been viewed as the canary in the economic coal mine, capable of signalling future developments in the business cycle and financial markets. While silver has nearly matched gold’s performance since the start of the decade, its price has remained confined within a tight trading range of $29 to $35. The first question is: what might uncage silver to break toward $40 or beyond? The leading candidate to trigger higher silver prices is simply rising gold prices. Indeed, the gold-to-silver ratio, which measures the relative value of gold to silver, serves as a critical macroeconomic indicator, offering insights into market sentiment, economic stability, and the relative strength of each metal as a store of value.
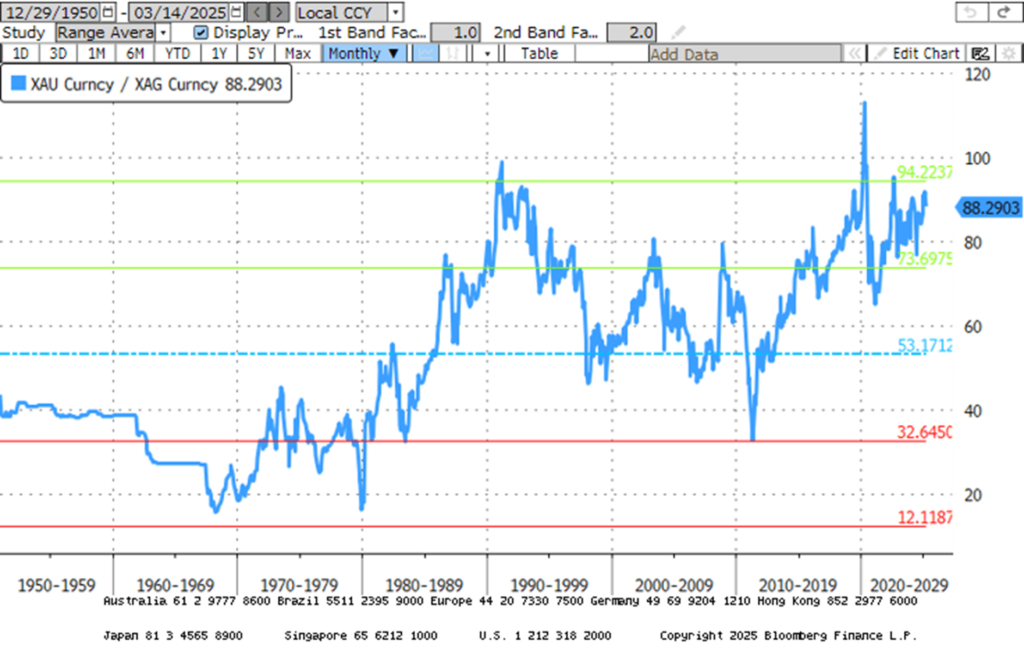
The common wisdom is that a rising gold-to-silver ratio typically intuitively suggests a flight to safety as investors favour gold amid economic uncertainty, inflation, or geopolitical tensions, often signalling risk aversion. Conversely, a declining ratio indicates that silver is gaining value relative to gold, which can occur during periods of economic expansion, industrial growth, or heightened demand for silver in manufacturing, such as in electronics and solar energy. At 89.4, the gold-to-silver ratio is trading nearly two standard deviations above its 75-year average of 53.2, making silver appear very cheap compared to gold. Gold itself is also with no doubts undervalued in USD terms as the war cycle intensifies in Eastern Europe, the Middle East, and potentially Asia.
Gold to Silver ratio since December 29th, 1950.
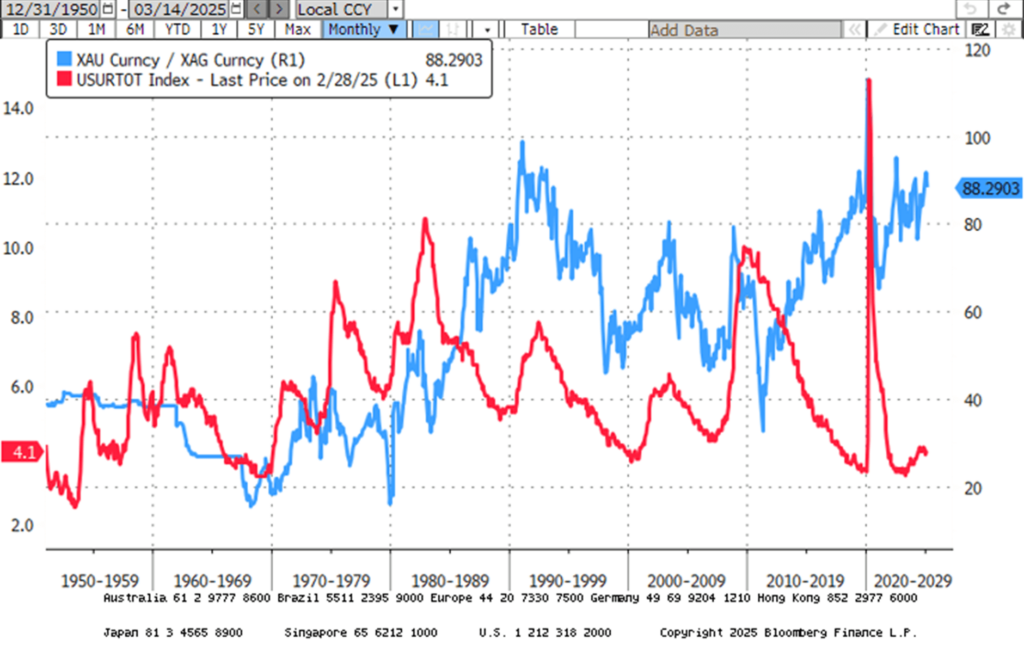
Examining the connection between the gold-to-silver ratio and economic data, this ratio is intimately linked with the US jobless rate. Particularly when unemployment rises in a pattern reminiscent of an economic bust, the gold-to-silver ratio tends to reach new highs, as it was the case during the peak observed during the lockdown crisis of early 2020.
Gold to Silver ratio (blue line); US Unemployment rate (red line).
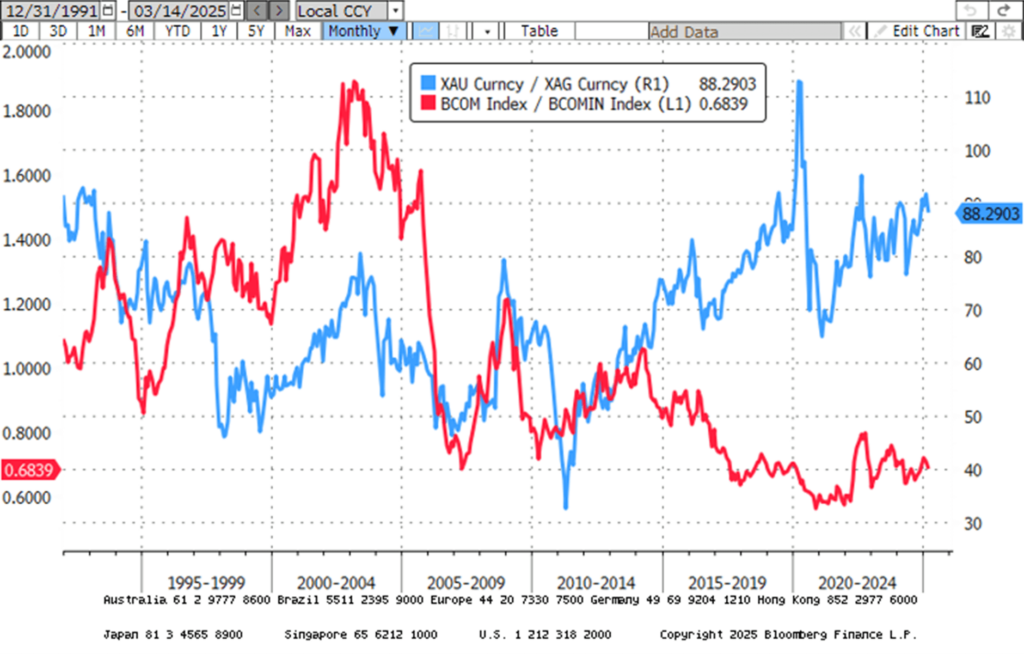
Given that silver undoubtedly has far greater industrial use than gold, it should come as no surprise that the relative performance of gold to silver is closely correlated with the outperformance of the Bloomberg Commodity Index over the Bloomberg Industrial Subindex. With industrial metals having outperformed since the start of the Jubilee Year, serving as one of the triggers for the impending unleashing of the commodity leviathan, investors with even a modicum of common sense should expect silver to outperform gold as well.
Gold to Silver Ratio (blue line); Relative performance of Bloomberg Commodity Index to Bloomberg Industrial Metals subindex (red line).
Savvy investors know that in Browne’s Permanent Portfolio, gold is for war, but wars also drive demand for strategic metals like silver. Used for centuries in military applications, silver’s conductivity, antibacterial properties, and corrosion resistance have made it essential in everything from ancient water storage to WWII wound dressings. Today, it’s critical for radar, communications, and missile guidance systems, cementing its role as a key defence material.
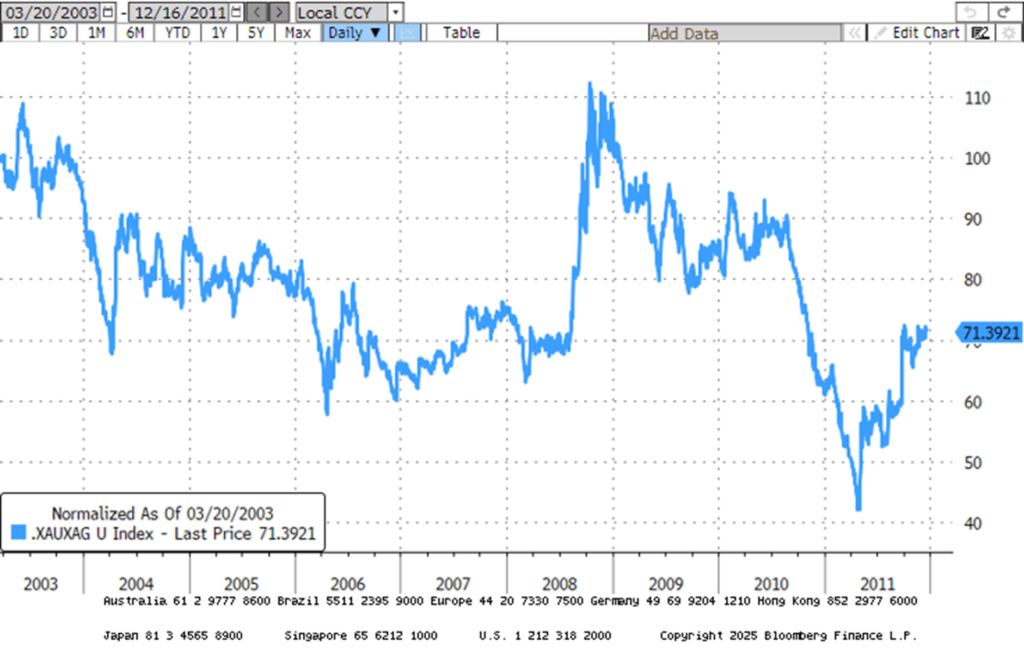
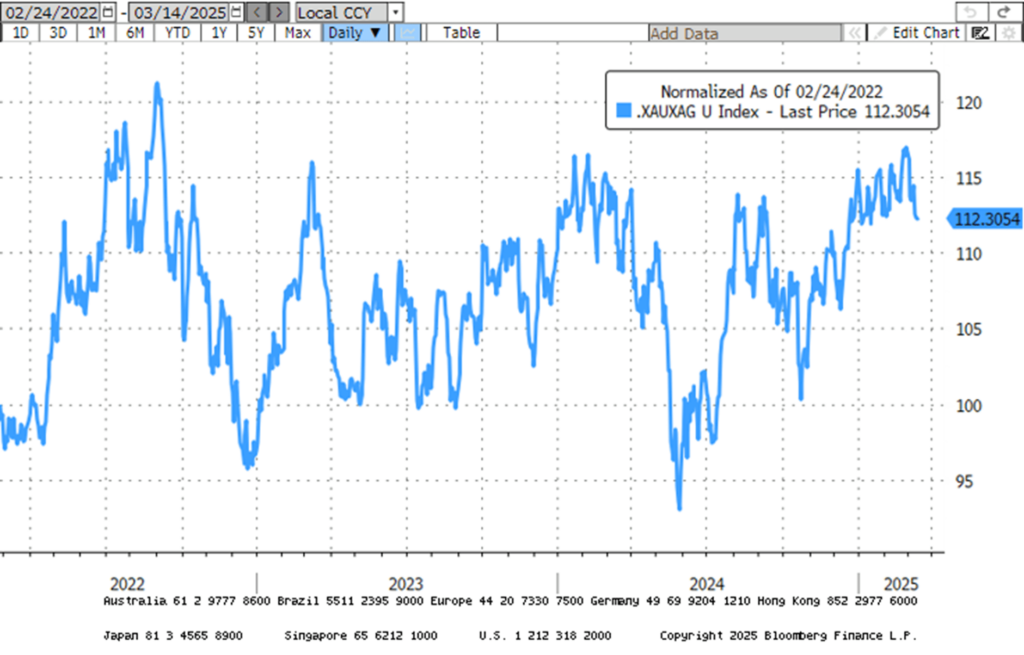
Historically, silver has outperformed gold during major conflicts over the past 75 years, including the Vietnam War and the Second Gulf War, despite its volatility. However, since the start of Russia’s ‘special operation’ in Ukraine, gold has outpaced silver, an anomaly likely to correct as the conflict escalates into what would unfortunately be remembered as World War III.
Evolution of $100 invested in the Gold to Silver ratio (blue line) between 1955 and 1975. (Vietnam War).

Evolution of $100 invested in Gold to Silver ratio (blue line) between 2003 and 2011 (Second Gulf War).
Evolution of $100 invested Gold to Silver ratio (blue line) since 24th February 2022. (Special Operation between Russia and Ukraine).
Understanding the gold-to-silver ratio therefore helps investors anticipate trends in the business cycle and adjust their portfolios accordingly, as shifts in the ratio often align with broader economic conditions, such as currency debasement, monetary policy, and global market dynamics.
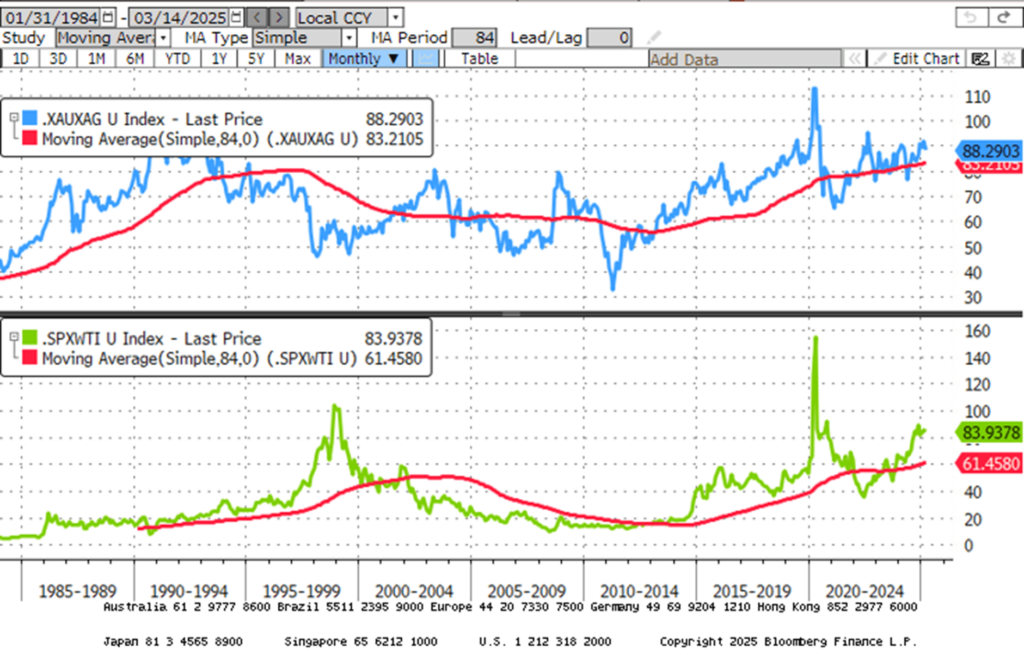
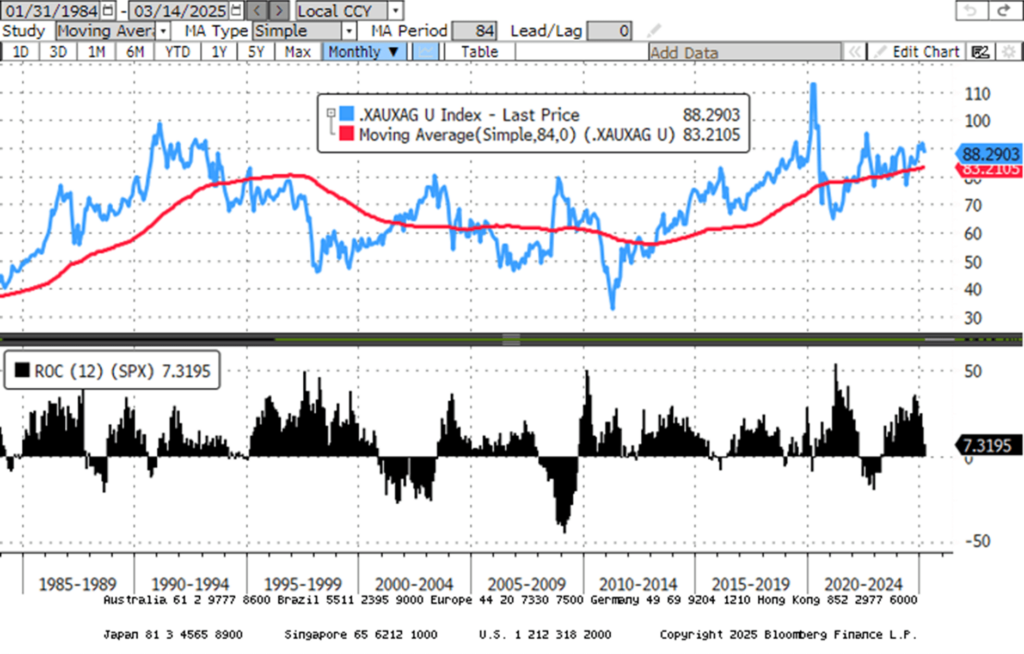
Examining how the gold-to-silver ratio has evolved during past economic busts, specifically when the S&P 500-to-Oil ratio falls below its seven-year moving average, reveals that, contrary to the wisdom spread in financial markets, the Gold-to-Silver ratio has traditionally served as a leading indicator of trends in the S&P 500-to-oil ratio relative to its seven-year moving average.
Upper panel: Gold to Silver Ratio (blue line); 84-month moving average of Gold to Silver ratio (red line); Lower panel: S&P 500 index to Oil ratio (green line); 84-month moving average of the S&P 500 index to Oil ratio (red line).
For equity investors, contrary to common wisdom, the Gold-to-Silver ratio breaking below its 7-year moving average has historically been a leading indicator of weaker, and ultimately negative, 12-month returns for the S&P 500. This was most recently the case in early 2020 and 2023.
Upper panel: Gold to Silver Ratio (blue line); 84-month moving average of Gold to Silver ratio (red line); Lower panel: S&P 500 index 12-month rate of return (yellow histogram).
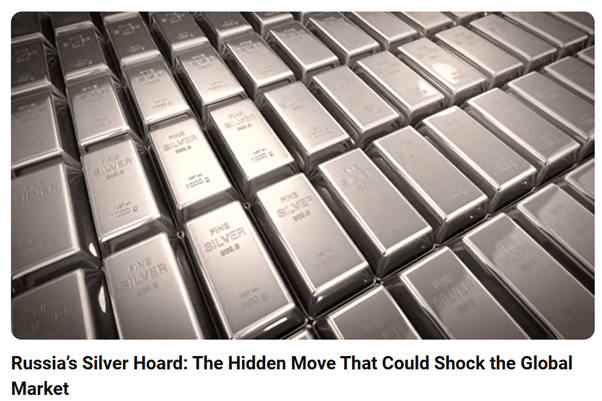
While silver prices are undeniably more tied to the business and war cycles in an increasingly weaponized world, where the so-called Western free world has attempted to impose its vision on others through force or by confiscating the assets of non-compliant countries, it’s unsurprising that central banks in the mercantilist Global South, seeking independence from American and NATO-driven imperialism, are beginning to build silver strategic reserves. In this context, Russia made a notable shift in its precious metal strategy in late October 2024, with silver potentially emerging as a key asset in the country’s expanding State Fund. This inclusion of silver in the State Fund’s acquisition strategy marks a departure from recent trends.
Although central banks worldwide, particularly Russia, have set records in gold purchases following international sanctions, silver has largely remained overlooked. This development suggests that silver’s role in Russia’s financial strategy may be evolving. Russia’s move is part of an ongoing response to economic sanctions that have isolated it from the SWIFT banking system, prompting a focus on diversifying reserves with antifragile liquid assets. However, the explicit mention of silver in this latest budget is significant, as it marks the first time a central bank has included silver in its purchasing plans during the current precious metals bull market.
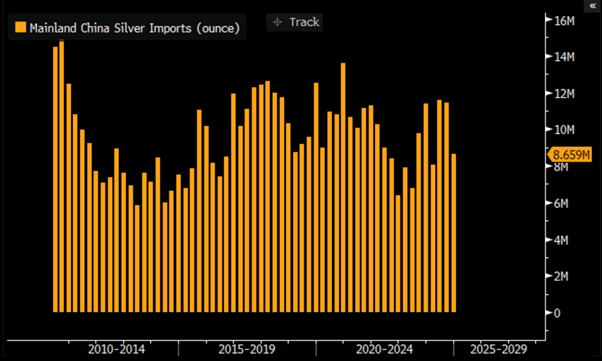
China has also been strategically stockpiling silver alongside its growing gold reserves as part of its broader effort to diversify assets and reduce reliance on the US dollar. As the largest producer and consumer of silver, China’s accumulation reflects the metal’s rising importance, both for industrial use and as a hedge against economic and geopolitical risks. This shift will inevitably tighten global silver supply, driving prices higher as demand outpaces available stockpiles.
Quarterly Mainland China Silver Imports since 2010.
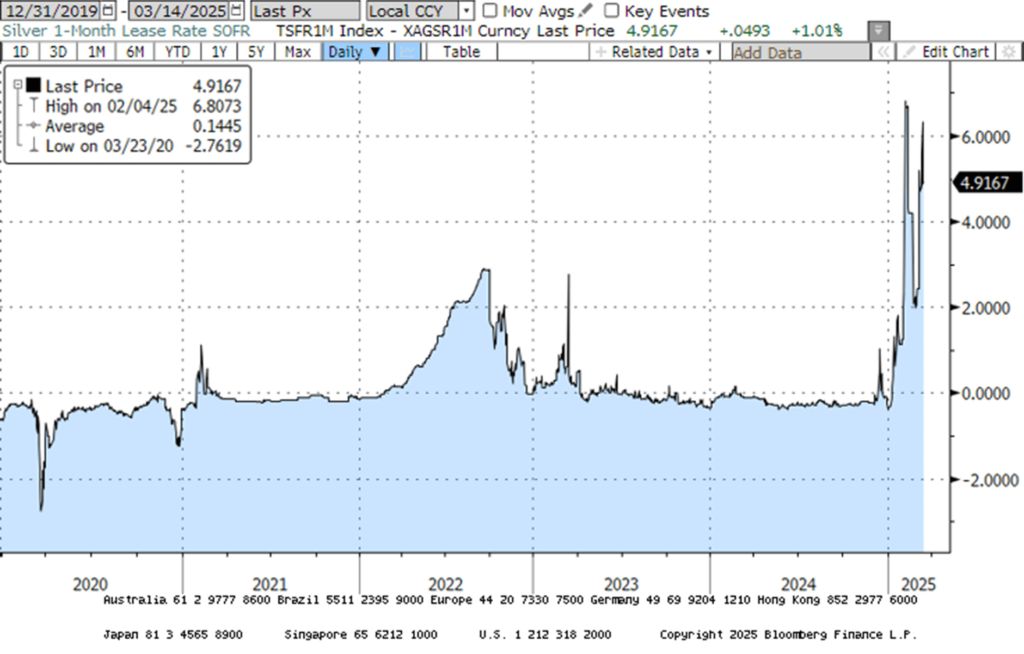
Investors who grasp the need to ‘gold with the flow or seize the tow’ have observed reluctance to lease gold in recent months due to a structural shortage in physical gold demand. Over the past three years, silver’s implied lease rates have inverted their historical norm, with short-term rates surpassing longer-term ones, amid a metal shortage that has depleted global silver vault stockpiles by over 500 million ounces.
This inversion signals that physical silver bars are scarcer than financial commentators claim, with only a fraction of London’s vaulted silver available for sale or lease. Silver’s bulkiness, relative to its value-to-volume ratio, has typically kept its lease rates negative or near zero, but since the start of the year, this trend has reversed, reinforcing the idea of a persistent silver market liquidity crunch.
Physical Silver 1-Month Lease Rate.
While silver is undoubtedly ‘a must-own’ for every investor seeking financial freedom, especially from tyrannical governments, particularly in the mislabeled ‘free’ Western world, investors should pause before allocating all their antifragile asset portfolio to physical silver. Indeed, silver is commonly referred to as ‘the devil metal’ not only for its role in biblical history but also due to its price volatility.
Indeed, silver has historically exhibited much higher implied volatility than gold, making it an unsuitable investment for more risk-averse individuals unable to tolerate sharp price swings. Still, it’s evident that silver offers greater upside potential than gold when measured in USD or other fiat currency terms.
3-months Implied volatilty of Physical Gold (blue line); Physical Silver (red line).
More than 2,000 years ago, Judas questioned the true value of silver, while Jesus revealed its deeper meaning, not merely as currency, but as a harbinger of crisis and betrayal. In this context, Judas and Jesus might have been overheard discussing the following on the plain of Judea.
Judas: (weighing the silver coins in his hand) Thirty pieces of silver… a price for a man, yet mere metal to the temple priests. Tell me, Rabbi, why does silver always carry such weight in the affairs of men?
Jesus: Because silver speaks not just of wealth, Judas, but of warning. Like a bird in the market winds, it calls out before storms arrive. The prophets spoke of famine and war, yet did they not also speak of silver turned to dross?
Judas: And yet, it is silver that fills the purses of kings and the hands of merchants. It buys bread today, though it may buy chains tomorrow.
Jesus: Indeed. Silver may shine in the hands of the trader, but when it darkens, it heralds ruin. The world chases after it, yet does not see when it foretells collapse. What good is a purse full of silver if the table is empty?
Judas: (clutching the coins) Then tell me, Master—what shall a man do when the weight of silver bears down upon him?
Jesus: He must know when to release it, lest it bind him. For silver, like trust, once betrayed, brings sorrow that no price can redeem.

As capital flows have always preceded financial crises and wars, investors are advised to ‘get aboard the silver bird’ and ‘satisfy your Walter Mitty mind, tryin’ out a dream.’ As the ‘Trump Re-flation’ morphs into ‘Trump Stagflation,’ ‘today is the day’ for investors to safeguard their wealth by owning real assets like physical gold and silver, the only antifragile assets with no counterparty risk. Investors will also need to hold other commodities to weather the storm unleashed by the ‘Commodity Leviathan.’

Additionally, investors will actively manage their cash allocation using a portfolio of short-dated, investment-grade (IG) USD bonds with maturities under 12 months and Treasury bills (T-bills) with maturities not exceeding 3 months. These income-generating assets will provide stability.
Among equities, investors should continue favouring low-leverage companies with strong EPS and FCF growth, prioritizing energy and commodity producers over consumers. By doing so, investors will emphasize the return of capital over the return on capital, ensuring both peace of mind and preserved wealth.
KEY TAKEWAYS.
As the Northern Hemisphere marks the Spring Equinox, the key takeaways are:
- The ‘Silver Bird’ remains undervalued against gold, with the gold-to-silver ratio far above its 75-year average, signalling a potential breakout above $40 as rising gold prices reflect escalating global conflicts.
- The gold-to-silver ratio historically closely tracks the U.S. jobless rate, but with industrial metals surging, silver is poised to outperform gold, despite Wall Street’s scepticism.
- The gold-to-silver ratio is a key macro signal, often leading shifts in the S&P 500-to-oil ratio, with silver poised for sharper moves as physical shortages grow.
- Silver has historically outshone gold in wartime, its recent underperformance is an anomaly set to reverse as global conflict intensifies.
- Russia’s silver play signals a central bank shift, cementing its role as an antifragile asset in a weaponized financial world.
- Silver’s liquidity crunch signals a deeper supply squeeze, offering explosive upside, but with far greater volatility than gold.
- In such environment, investors will once again need to focus on the Return OF Capital rather than the Return ON Capital, as stagflation spreads.
- Physical gold and silver remain THE ONLY reliable hedges against reckless and untrustworthy governments and bankers.
- Gold and silver are eternal hedge against “collective stupidity” and government hegemony, both of which are abundant worldwide.
- With continued decline in trust in public institutions, particularly in the Western world, investors are expected to move even more into assets with no counterparty risk which are non-confiscable, like physical Gold and Silver.
- Long dated US Treasuries and Bonds are an ‘un-investable return-less’ asset class which have also lost their rationale for being part of a diversified portfolio.
- Unequivocally, the risky part of the portfolio has moved to fixed income and therefore rather than chasing long-dated government bonds, fixed income investors should focus on USD investment-grade US corporate bonds with a duration not longer than 12 months to manage their cash.
- In this context, investors should also be prepared for much higher volatility as well as dull inflation-adjusted returns in the foreseeable future.
HOW TO TRADE IT?
As of March 14th , 2025, the US remains in an inflationary boom, but with the S&P 500 to Gold ratio now below its year below its 7-year moving average for more than a month, an inflationary bust will materialize much sooner than Wall Street pundits and their parrots are eager to tell their clients. In this context, investors should stay calm, disciplined, and use market data tools to anticipate changes in the business cycle, rather than fall into the forward confusion and illusion spread by Wall Street.

Like physical gold and other precious metals, the best way to own silver in a diversified portfolio is to purchase the metal outright and store it in a private, secure vault outside the banking system. This method is simple, clean, liquid, and likely to hold few negative surprises. However, investors must consider that silver’s lower value per gram makes it bulkier to store in terms of value. An alternative is trading a Physical Silver ETF, though this removes the decentralized nature of physical silver, as these ETFs are subject to stock exchange rules and the counterparty risk of the ETF issuer. More adventurous investors can buy silver royalty companies, though many offer lower beta to silver price changes and trade at relatively high valuations. Another option is to invest in silver miners, which remain unloved by equity investors. While many stocks are attractively valued and under-owned, these miners often operate in jurisdictions like Peru and Bolivia, where property rights can be flexible, especially when metal prices rise and governments face economic pressures to satisfy voters.
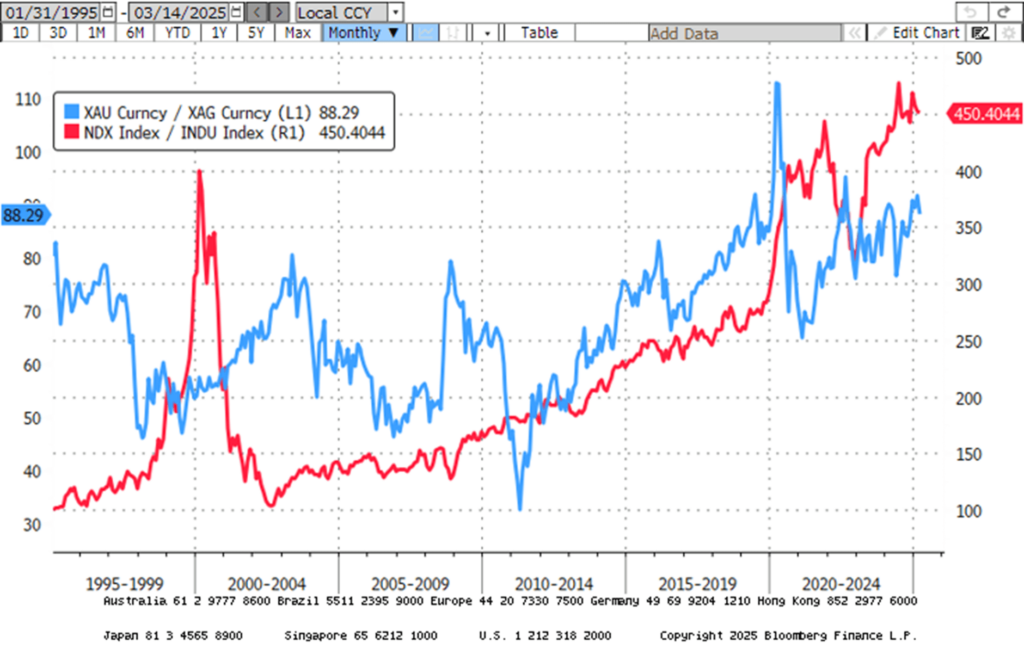
Equity investors should note that when the Gold-to-Silver ratio peaks and reverses, a cyclical Nasdaq-to-Dow peak has historically followed closely. This suggests that the ‘Silver Bird’ will also be a useful guide for portfolio allocation between the Dow and Nasdaq as the U.S. economy transitions from an inflationary boom to an inflationary bust.
Gold to Silver Ratio (blue line); Nasdaq to Dow Jones Ratio (red line).
As common wisdom will increasingly be important as challenging times lie ahead it is important to remember that as an investor ‘Almost nothing is presented to you on a silver platter. You will have to really work for it’.